In this how-to guide, users will learn how to create accessible documents. MS Word and Google Docs have many features built-in that help people with different abilities to read and author documents. Microsoft Word also offers an accessibility checker which locates elements that might cause problems for people with disabilities.
What will be learned?
Learn how to (1) make your documents accessible and (2) check your documents, making sure they are designed for all students and users of your course content.
Why is it important?
This is an important skill to know due to the fact that we have often have many different documents in our online courses, and knowing they are fully accessible is needed for all students’ success.
Who benefits?
This benefits students who are differently abled but also benefits all students through universal design.
How-To Guide: Accessible Word & Google Documents
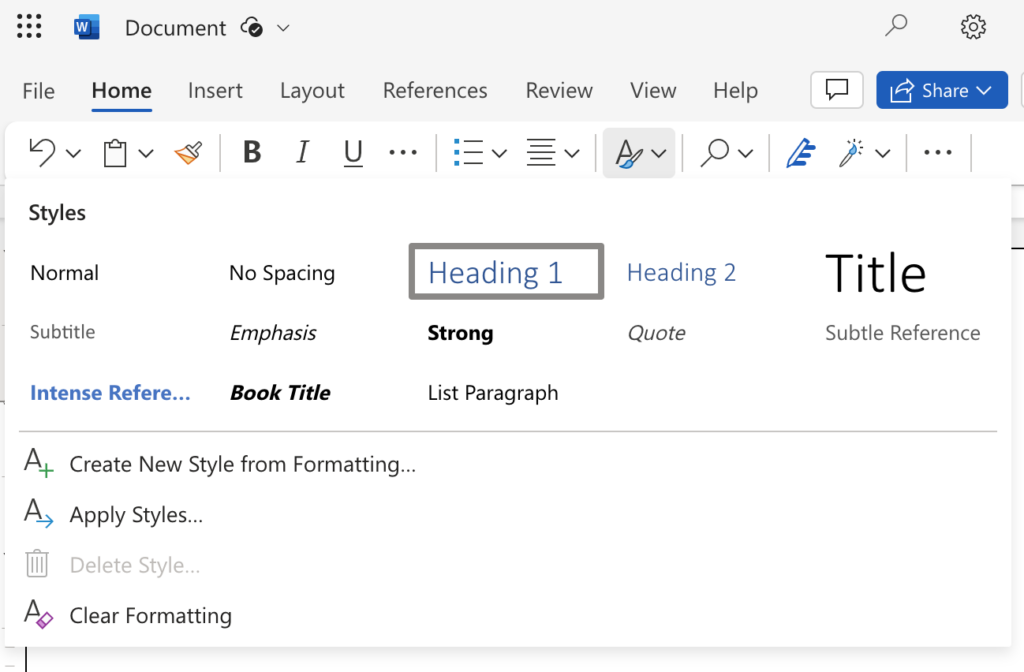
Use Headings
Good heading structure helps people without eyesight understand how the document is organized. It also provides consistency and helps to reduce cognitive load for everyone. Use the guidelines in the Headings and Structure section of Getting Started with Accessibility.
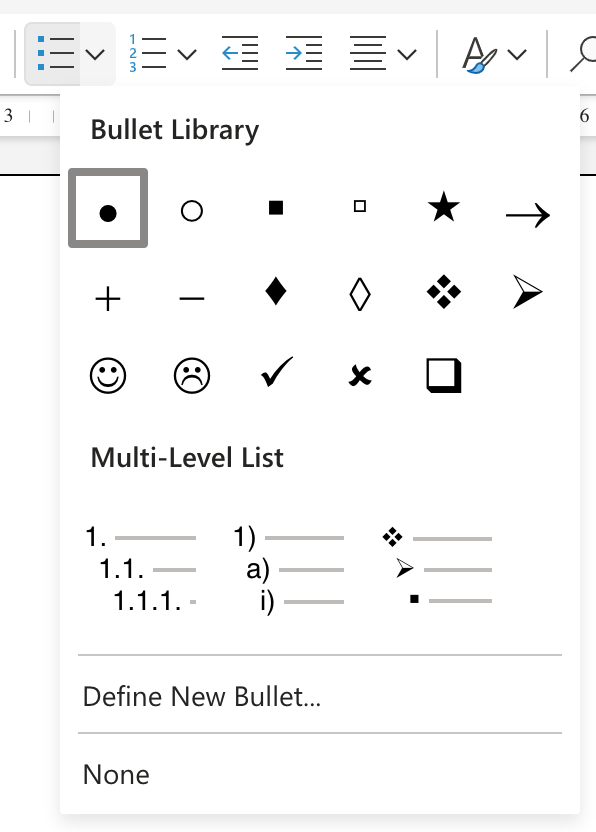
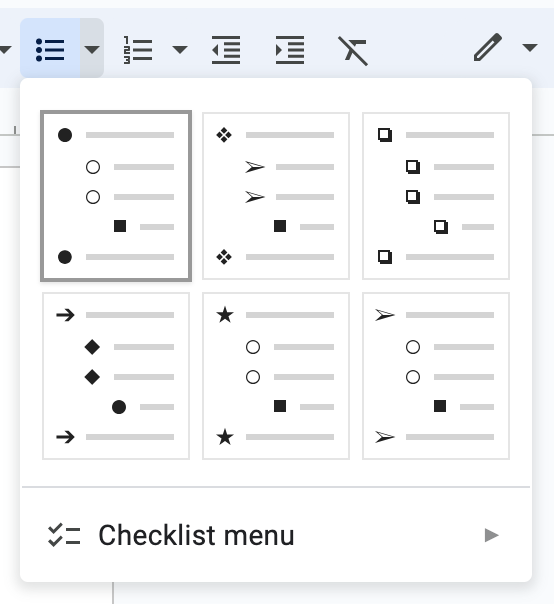
Use Lists
Using list controls, such as bullets, aids screen readers in conveying content structure. Visually, list controls also provide structure through consistent, orderly formatting. When lists controls are used to specifically create lists it helps screen readers to understand how the content is organized.
MS Word
Google Docs
On the Home Ribbon, choose the appropriate heading in the “Styles” section.
Use the Headings drop down box, located on the toolbar styles menu.
Select a list style from the Bullet Library.
Select a list style from the Bulleted List Menu.
This short video demonstrates how to add alt text to a MS Word document and a Google Doc.
For MS Word:
Select the image.
Right click; select “Edit Alt Text.”
In the Alt Text box, enter description.
For Google Docs:
Select the image.
Right click; select “Alt Text…”
In the Alt Text box, enter description.
Using strong color contrast allows people with low vision to see your content easier. To check contrast, use the WebAIM contrast checker.
Highest Contrast
Complementary colors (those opposite each other on the color wheel) provide the highest color contrast, making them ideal for text and graphics color.
Lowest Contrast
Analogous colors (those next to each other on the color wheel) provide the lowest contrast and should be avoided.
Font size should be no less than 11 pt.
Justified text is more difficult to read because of extra space between the words.
Adjust the text and alignment by going to the Home tab in Word or Google Docs and changing the font type, font size, and the alignment as needed.
Screen readers scan for links, so informative link text is helpful.
To add a hyperlink in MS Word:
Select the text or image.
From the Insert tab, select Link.
In the Insert Hyperlink box, paste the URL address in the “Address” box; Click OK.
CREATING ACCESSIBLE PDFS FROM MS WORD, INDESIGN & ACROBAT
In this how-to guide, users will learn how to create accessible PDF files from Microsoft Word, Adobe InDesign, and Acrobat Pro.
What will be learned?
Participants will learn how to add accessibility tags to PDF files created from Word and InDesign documents, and how to use the Make Accessible action in Acrobat Pro to make PDFs accessible.
Why is it important?
Adding accessibility tags to PDF files makes it easier for screen readers and other assistive technologies to read and navigate a document, with Tables of Contents, hyperlinks, bookmarks, alt text, and so on. Accessibility tags also make it possible to read the information on different devices, such as large type displays, personal digital assistants (PDA), and mobile phones.
Who benefits?
This benefits students who are differently abled but also benefits all students through universal design.
How-To Guide: Accessible PDFS from Microsoft Word
Before creating your PDF, use the steps on this website to create an accessible Word document:
When you’re ready to create your PDF, choose Save As from the File menu.
On a Mac, name your file, and then choose PDF from the File Format menu. Select Best for electronic distribution and accessibility to create a tagged PDF. Click Export.
On a PC, choose PDF from the Save as Type menu. Select Standard (optimize for) and click Options.
Make sure that Document structure tags for accessibility is selected. Click OK. Click Save.
How-To: InDesign
Use Paragraph Styles consistently throughout the document. Base them on their hierarchical structure (main heading, sub headings, body text, etc.).
To create a paragraph style, choose Paragraph Style from the Type menu and then New Paragraph Style.
Name the style and apply formatting as necessary.
To apply a paragraph style, select the text and then the style from the Paragraph Styles panel.
Establish export tag relationships between InDesign styles and PDF tags.
In the Paragraph Styles panel, double-click to open the Paragraph Styles Options window.
Click Export Tagging and select the appropriate tag to be mapped when exported to a PDF.
Specify alternative text for images.
Select the image and then select Object Export Options from the Object menu.
On the Alt Text tab, choose Custom for Alt Text Source and enter your alternative text. Click Done.
Specify a document title and description as metadata.
Choose File Info from the File menu.
Enter a document title and other description on the Basic tab. Click OK.
Export as PDF with settings optimized for accessibility.
Choose Export from the File menu. From the File Type menu, choose either Adobe PDF (Print) or Adobe PDF (Interactive). Click Save.
Make sure that Create Tagged PDF is selected and click Export.
How-to: Accessible PDFS from Acrobat Pro
You can automate fixing accessibility issues in Acrobat Pro using the Make Accessible action.
Click on the Tools tab at the top of the screen, scroll down, and click on the Action Wizard Icon.
Click on the Make Accessible action in the Actions list.
In the Make Accessible action, add any additional files you want to make accessible, and then click Start.
The action will automatically walk you through the steps to make a PDF accessible. Make your changes in the dialog boxes presented. Acrobat will then run the Accessibility Checker and present any additional issues you need to correct.
In this how-to guide, users will learn how to create accessible spreadsheets. These spreadsheet creation tools also offer the accessibility checkers that locate elements that might cause problems for people with disabilities. Learn how to make your spreadsheets accessible, making sure they are designed for all students and users of your course content.
What will be learned?
Participants will learn how to make their Microsoft Excel and Google Spreadsheets accessible.
Why is it important?
This is an important skill to know because we have often many different documents in our online courses, and knowing they are fully accessible is key for all students’ success.
Who benefits?
This benefits students who are differently abled but also benefits all students through universal design.
How-To Guide: Accessible Excel & Google Spreadsheets
Indicate the default language for the workbook.
Excel
Google Sheets
In Excel on a PC, choose Options from the File menu. Click on Language and indicate the Editing and Display language. Click Set as Default and then click OK.
In Google Sheets, choose Spreadsheet Settings from the File menu and click on the Language.
In Excel on a Mac, choose Language from the Tools menu. Choose the default language and then click OK.
Write a Worksheet Summary in cell A1 of every sheet in your workbook. The summary should provide a description of the worksheet as well as an explanation of how to navigate the worksheet.
Provide a unique name for each sheet (tab) in the worksheet.
In both Excel and Google Sheets, right-click (or CTRL-click on Macs) on the tab and choose Rename.
Specify header rows and columns in and name your data tables.
In Excel, you must first select the data and then choose Table from the Insert menu. Be sure to check My table has headers. You can format and name your table on the Table tab.
Google Sheets does not have a way to specify header rows and columns.
Write alternative text for charts, graphs, shapes, and other images. Complex images (requiring more than 1–2 sentences to adequately describe) should include long descriptions either directly on the worksheet or direct the user to a separate worksheet that includes the long description.
Excel
Google Sheets
In Excel, right-click (or CTRL-click on a Mac) on the image and choose Edit Alt Text.
In Google Sheets, click on the chart or graph, then click the options menu in the upper right corner of the image.
Enter 1–2 descriptive sentences; or if the image conveys no information, check Mark as decorative.
Choose Alt Text and enter a description of the chart, graph, or other image. Click OK.
Select the data range you want to name.
In Excel, choose Name from the Insert menu and then Define Name. Enter a descriptive name and click OK.
In Google Sheets, choose Named Ranges from the Data menu, enter a descriptive name, and press Enter (Return).
Avoid blank cells and rows in your spreadsheets.
Screen readers will read the formulas contained in cells.
Try to keep the structure of your data tables simple. Do not nest multiple tables within a table, or split or merge cells within tables.
Learn to create accessible tables by adding a caption, organizing the semantic markup for row and column headers, and using relative values rather than pixel values for sizing.
Why is it important?
Tables allow orderly presentation of data. If they are not accessible, someone using an assistive device may not be able to tell which are the rows and which are the column headers. The table cells might even be read out of order, which would be confusing.
Who benefits?
Accessible tables enable people who cannot see them to make the associations between the tables and their rows and column headers as well as process the cells of the table in a logical way.
How-To Guide: Accessible Table Types
Tables tend to be better for accessibility when used for data, but if created correctly, they can also be used for page layouts.
Regardless of which table type you create, keep the following suggestions in mind:
If using for layout, consider alternatives to using a table (would a bulleted list or columns be sufficient?).
Keep tables simple (no nested tables, split or merged cells).
People using screen readers to have the table read aloud to them may struggle to understand its layout.
Avoid leaving cells blank (especially for spacing).
If it must be left blank, label it as “blank” (hide it visually by matching the text color to the background).
Check reading order by tabbing through the table.
Content should read logically from left to right, top to bottom.
Show a relationship between at least two items.
Can be numbers, words, categories, observations, etc. that show a connection to each other.
Header, caption, and summary MUST be used to show the relationship between rows and columns.
Used to position content in a document or page.
Do not represent a relationship between information in the cells.
Reading order is most essential.
Header, caption, and summary should NOT be used.
Layout tables could be confusing since there is no connection between columns and rows.
Best practices discourage layout tables for web pages.
Insert a table rather than only using spaces or tabbing. Select the top row and indicate that it is a Header row in the Table Design tab.
If a table spans multiple pages, ensure the Header row repeats.
In Microsoft Word, select the row, right-click to view Table Properties, and check “Repeat as header row.”
Add a caption tag to the table to summarize its contents and purpose.
In Word, right-click the table and select “Insert Caption…”
Describe the purpose and interpretation of the table in the text preceding the table; this will help all users.
Add alt text to the table.
Right-click the table and select Table Properties.
Select the Alt Text tab from the Table Properties box.
Enter short description in the Description box.
How-To Guide: Accessible Tables in Websites
Add a caption tag to the table to summarize its contents and purpose.
Describe the purpose and interpretation of the table in the text preceding the table; this will help all users.
Example: HTML of a Table on a Website with Caption
<table>
<caption>Monthly Ice Cream Sales </caption>
…
</table>
Organize semantic markup for row and column headers.
Header cells must be <th>. Data cells must be <td>.
If tables have complicated headers, you may need to use scope, id, and headers attributes.
Example: HTML of Correctly Marked Up Table
<table style=”width:100%”>
<caption>Group Member Names and Ages</caption>
<tr>
<th>Lastname</th>
<th>Age</th>
</tr>
<tr>
<td>Smith</td>
<td>50</td>
</tr>
<tr>
<td>Jackson</td>
<td>94</td>
</tr>
</table>
Use relative values rather than pixel values for sizing.
Some users with low vision may struggle with scrolling horizontally and others may wish to zoom in on tables, so using proportional sizing will aid them.